


On Monday morning, President Trump announced plans to impose 25% tariffs on steel and aluminum imports — a sweeping policy move that’s certain to reshape the Materials sector. While this can negatively affect several industries, domestic steel producers are likely to benefit from increased demand.
How Markets Reacted to the 25% Tariff Announcement
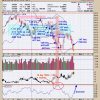
The StockCharts MarketCarpets provides a clear visual of how investors reacted when the tariff announcement made headlines.
FIGURE 1. MARKETCARPETS VIEW OF THE MATERIALS SECTOR. Notice the top gainers consist of domestic metals producers.Image source: StockCharts.com. For educational purposes.
The stocks that gained the most following the announcement were Steel Dynamics, Inc. (STLD) and Nucor Corporation (NUE), both domestic steel producers, as well as Newmont Corporation (NEM), a mining company focused on gold and copper extraction.
The surge in STLD and NUE reflects investor expectations that tariffs will curb foreign competition, allowing US steelmakers to raise prices and expand market share. NEM also gained, likely due to broader market concerns over trade tensions and inflation. On top of this, copper — a key industrial metal — could see supply chain shifts or price fluctuations, depending on how tariffs impact global trade flows.
Let’s take a longer-term look at these stocks relative to the Materials sector and the broader market (S&P 500). Below is a PerfCharts view of their relative performance over the last year.
FIGURE 2. PERFCHARTS OF THE S&P 500, XLB, STLD, NUE, AND NEM. Though NEM outperformed, the other stocks and the Materials sector underperformed the broader market.Chart source: StockCharts.com. For educational purposes.
Global steel production decreased in 2024. So it’s no surprise that the Materials Select Sector SPDR Fund (XLB), our sector proxy, underperformed the S&P 500, and that many steel producers and miners would also underperform the broader market and sector. Interestingly, NEM outperformed the S&P 500, XLB, STLD, and NUE in 2024 due to surging gold prices, strong financial performance, increased gold production, and free cash flow.
Still, if the new tariff environment remains unchanged, then NEM and especially STLD and NUE may have plenty of room to run. Let’s take a look at the sector and all three stocks to see if there are any present trading opportunities.
Let’s start with XLB. Take a look at a 5-year seasonality chart of XLB to get some context.
FIGURE 3. 5-YEAR SEASONALITY CHART OF XLB. Sector performance tends to follow a cyclical pattern, with March, July, and November historically seeing the highest close rates and average gains.Chart source: StockCharts.com. For educational purposes.
Geopolitical shifts under the new administration will likely reshape seasonal trends. Nevertheless, historical context remains valuable. Over the past five years, March has been XLB’s second-strongest month, with a 75% higher-close rate and an average gain of 4.8%. That’s the seasonality picture.
Now, let’s look at the price action from a longer-term trend perspective. Below is a weekly chart of XLB.
FIGURE 4. WEEKLY CHART OF XLB. While the Materials sector has lagged behind the S&P 500, it’s been trending upward nevertheless.Chart source: StockCharts.com. For educational purposes.
This five-year chart shows XLB underperforming the S&P 500. If you go back a few decades, this negative performance has been steady. Yet XLB, due to overall market growth, inflation, and sector-specific cycles, has been trending up in absolute terms.
Demand for materials is cyclical, and the Materials sector Bullish Percent Index ($BPMATE), a breadth indicator, illustrates this clearly. Currently, the BPI is moving upwards, with 31% of stocks within the sector flashing Point & Figure buy signals. Typically a crossover from below to above 30% would issue a bull alert; a move above 50% would strongly favor the bulls, signifying that buyers have the edge. Understanding XLB’s broader trend helps contextualize whether the stocks within the sector are moving with or against the sector’s trend relative to their trajectories.
Let’s look at the daily chart of NEM.
FIGURE 5. DAILY CHART OF NEM. Is it a new bullish trend or a bear rally?Chart source: StockCharts.com. For educational purposes.
NEM is attempting to recover from a steep selloff that began in October. The key question is whether the bullish reversal signals the start of a robust recovery or a temporary bounce within a sustained downtrend.
To gain insight into this question, let’s examine a couple of indicators: one that measures momentum and another that analyzes volume. Volume-wise, the Accumulation/Distribution Line (ADL) plotted behind the price shows strong money flow into the stock, its buying pressure supporting NEM’s recovery. The Commodity Channel Index (CCI) is showing strong bullish momentum, yet indicates that NEM may be sailing into overbought conditions.
The key levels to watch are near the top line (Leading Span B, red cloud) and the projected bottom line (also the Leading Span B, but in the green section) of the Ichimoku Cloud. If price declines at or near the top, but bounces at the bottom, the bullish reversal thesis remains intact, signaling a potential early buying opportunity for those looking to get into the stock. If prices fall below the bottom level, the downtrend is likely to resume.
Now let’s look at the domestic steelmakers on the list, starting with a weekly chart of STLD.
FIGURE 6. WEEKLY CHART OF STLD. The stock price looks like it’s in a volatile ascent.Chart source: StockCharts.com. For educational purposes.
I’m highlighting a weekly rather than a daily chart for two reasons: First, you can’t see the larger (trend) context on a daily chart, and second, the key levels are just as apparent in the weekly as in the daily chart.
Over the last six years, of which the last three are shown on the chart, STLD has been trending upward with increasing volatility. Steel production in the US may have decreased significantly in 2024, yet STLD prices continue to cumulatively rise. This trend underscores the inherent cyclicality of the steel industry, as evidenced by the fluctuating prices.
NOTE: Although “seasonality” and cyclicality can be related, the latter refers more to macroeconomic, industry, and supply-demand shifts. These typically drive fluctuations in a manner that gets smoothed out in seasonality charts. So, when I use the term “cyclicality,” I’m referring to these fluctuations before them being “averaged out” in a seasonality calculation.
The ZigZag line illustrates the major swing highs and lows that define the trend, as well as key support and resistance levels. If STLD’s uptrend were to maintain its trajectory, price must stay above the swing low level slightly above $110 (see magenta line) and eventually break above resistance at the most recent swing high at $155. Given this is a weekly chart, it may take months to play out (assuming the longer-term uptrend sustains itself).
Note, however, that the selling pressure appears to be the dominant driver for near-term volume, according to the Chaikin Money Flow (CMF). If volume precedes price in this particular instance, then a pullback may be imminent.
Last, but not least, take a look at a daily chart of NUE.
FIGURE 7. DAILY CHART OF NUE. The stock is in a downtrend and all the indicators spell a bear rally.Chart source: StockCharts.com. For educational purposes.
NUE may have jumped 6.24% on Monday, but what are investors rushing into? While Trump’s 25% tariffs on steel and aluminum imports are likely to boost domestic steel producers, NUE is amid an arguably robust downtrend.
Its response to the 61.8% Fibonacci Retracement (drawn from the December high to low) isn’t promising either, making the recent surge look more like a bear rally than a bullish trend reversal. Additionally, the CMF has remained largely negative, dipping well below the zero line and recently crossing it again, indicating that selling pressure continues to dominate.
However, there are shoots of hope, as NUE appears to be rising against the broader Dow Jones U.S. Iron & Steel Index ($DJUSST) of which NUE is a component (see magenta line). If NUE stays above the $115 level (the most recent swing low), then such a level may signal a bottom. Of course, you’ll want to make sure that volume and momentum support are aligned with this potential reversal.
At the Close
If you’re bullish on U.S. steel producers, consider adding these stocks to your ChartLists, keeping a close watch on the MarketCarpets Materials sector view, and staying informed on industry news. With these tools and insights, you’re likely to spot a market opportunity.
Disclaimer: This blog is for educational purposes only and should not be construed as financial advice. The ideas and strategies should never be used without first assessing your own personal and financial situation, or without consulting a financial professional.