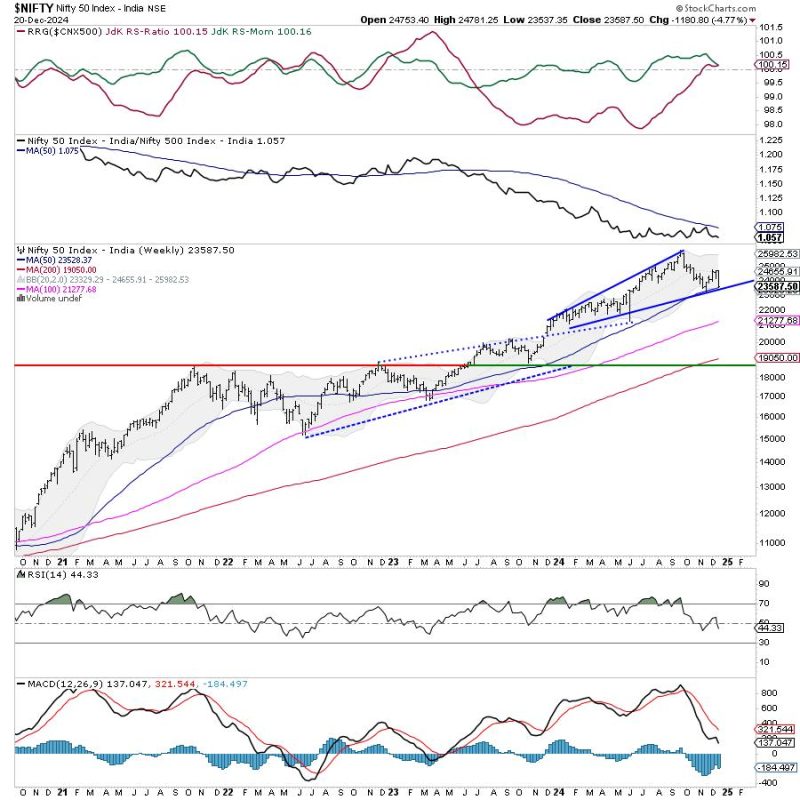
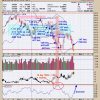
After staying in the green following a sharp rebound the week before this one, the markets finally succumbed to selling pressure after failing to cross above crucial resistance levels. The Nifty stayed under strong selling pressure over the past five sessions and violated key support levels on the daily charts. The range remained wider on the anticipated lines; the Nifty traded in a wide 1243-points range over the past days. Volatility shot up as well; the India VIX surged 15.48% higher to 15.07 on a weekly basis. Following a weak performance, the headline index closed with a weekly loss of 1180.80 points (-4.77%).
Over the past few days, the Nifty has shown many technical events highlighting the importance of some key levels. The Index resisted the 100-DMA for several days and the 20-week MA for some time; this highlights the importance of these levels as key resistance points for the markets. In the process, the Nifty closed below the key 200-DMA, placed at 23834 while dragging the resistance points lower. The Nifty has also closed a notch above the crucial 50-week MA level placed at 23530. The markets had staged a mosterous rebound when this level was tested before. The Nifty’s behavior against the level of 50-week MA would determine the trajectory not just for the coming week but also for the immediate near term as well.
Next week is truncated, with the Christmas holiday on Wednesday. Expect a tepid start to the week on Monday. The levels of 23750 and 23830 would act as potential resistance points. The supports come in at the 23500 and 23285 levels on the lower side.
The weekly RSI is 44.41; it stays neutral and does not show any divergence against the price. The weekly MACD is bearish and stays below its signal line. The widening Histogram hints at accelerated downside momentum. A large black candle occurring at the 20-week MA adds to the credibility of this level as a major resistance area for the markets.
The pattern analysis of the weekly charts shows that after completing the painful mean reversion process, the Nifty staged a strong technical rebound after it took support at the 50-week MA. The Index resisted at the 100-DMA and the 20-week MA, which are close to each other. The intense selling pressure over the coming week has seen the Nifty almost retesting the 50-week MA by closing just a notch above this point. The Nifty must keep its head above this crucial support level to keep its primary uptrend intact. If this level gets meaningfully violated, we might be in for a prolonged intermediate trend over the coming weeks.
Even if the trend remains weak and the downtrend continues, a modest technical rebound cannot be ruled out. However, it would still keep the markets under corrective retracement unless a few key levels are taken out on the upside. It is strongly recommended that leveraged exposures be kept at modest levels. All new exposures must be highly selective, and all gains, even modest ones, must be guarded very carefully. It is also recommended that one not rush in to shorten the markets so long as they are above 50-week MA, as there is a possibility of a modest technical rebound. A highly selective and careful approach is advised for the coming week.
Sector Analysis for the coming week
In our look at Relative Rotation Graphs®, we compared various sectors against CNX500 (NIFTY 500 Index), which represents over 95% of the free float market cap of all the stocks listed.
Relative Rotation Graphs (RRG) show Nifty Bank, Financial Services, Services Sector, and the IT indices inside the leading quadrant. These sectors are likely to outperform the broader markets relatively.
The Nifty Pharma Index is inside the weakening quadrant. The Midcap 100 Index is also inside the weakening quadrant but is improving its relative momentum.
The Nifty Media, Energy, Commodities, Auto, and FMCG indices continue to lag inside the lagging quadrant. The Consumption Index has rolled inside the lagging quadrant as well. These groups are likely to underperform the broader Nifty 500 Index relatively. The Nifty PSE Index is also inside the lagging quadrant but is improving its relative momentum against broader markets.
The Infrastructure Index has rolled inside the improving quadrant and is likely to begin its phase of relative outperformance. The Realty and the PSU Bank Indices are also inside the improving quadrant. The Metal Index, also inside the improving quadrant, is sharply giving up on its relative momentum.
Important Note: RRG charts show the relative strength and momentum of a group of stocks. In the above Chart, they show relative performance against NIFTY500 Index (Broader Markets) and should not be used directly as buy or sell signals.
Milan Vaishnav, CMT, MSTA
Consulting Technical Analyst


