The Fed is flying trial balloons about the end of the interest rate hike cycle, but the technology sector is ignoring them as the smart money move to energy continues.
Last week, Philadelphia Fed Governor Patrick Harker, in a Philadelphia speech, suggested the central banks should pause their rate hikes. Moreover, even though the CPI inflation numbers were relatively tame, markets seemed to focus on the more negative details inside the report, such as persistently high rents and car insurance prices.
Interestingly, producer prices (PPI) rose as well, but much of the climb was due to an increase in fees by money managers – hardly a widespread expense as compared to gasoline and food. Meanwhile, consumer confidence is flat and inflation expectations are improving.
Still, money flows in bonds and stocks suggest otherwise. That’s not a good turn of events, if not reversed, especially when the Fed is trying to gauge the market’s response to a potential extended pause on its rate hikes.
As Tech Weakens, New Leaders Appear
Last week in this space, I noted “short sellers are starting to smell blood in the water in the tech sector.” This week, the evidence piled up further as the bloom is wearing off the AI rose, at least for now. You can see that sellers have gained the upper hand as the Invesco QQQ Trust (QQQ) has broken below its 50-day moving average, as both Accumulation/Distribution (ADI, increasing short sales) and On Balance Volume (OBV, buyers turning into sellers) have also rolled lower.
But QQQ is not alone. A more focused picture of the selling in AI and robotics-related stocks can be seen in the shares of the ROBO Global Robotics and Automation ETF (ROBO), which has fallen back to what may be long-term support near $54. If ROBO fails to hold in this general area, which features two very large Volume-by-Price bars (VBP) and the 200-day moving average as key markers, the decline will likely accelerate.
A stark example of how rising costs are impacting emerging technology companies was the collapse of solar tech company Maxeon Solar Technologies (MAXN), whose shares cratered after the company missed its earnings estimates and lowered forward guidance, citing “falling demand” for its products while partially blaming the situation on higher interest rates.
Meanwhile, shares of energy stocks, such as refiner Valero Energy (VLO), continue to power higher as the fuel supply and demand balance is steadily tipping toward the energy patch. This view is supported by the steady downward pace in the weekly oil rig count. There are now 125 fewer active rigs in the U.S. compared to the same period in 2022.
VLO is emerging above a stout resistance shelf, marked by a large cluster of Volume-by-Price (VBP) bars extending back to the $107 area. A move above $140 would likely lead to higher prices in a hurry. I recently discussed how to spot the smart money’s footprints and how to turn them into profits; you can check out the video here.
Over the last few weeks, I’ve asked whether it’s time to sell the tech rally. What should you do with your energy holdings? And what about the homebuilder stocks and the REITs? The answers are in the model portfolios at Joe Duarte in the Money Options.com, updated weekly, and via Flash Alerts as needed. You can have a look at all of them and my latest recommendations on what to do with each individual pick FREE with a two week trial subscription. And, for an in-depth review of the current situation in the oil market, homebuilders and REITS, click here.
Bonds, Oil, and Stealth Inflation
The lack of enthusiasm from bond traders about the CPI numbers, quirky PPI numbers and a Fed governor suggesting the central bank may stop raising rates soon suggests there is more going on than meets the eye. The answer may be future inflation related to limited supplies of products and services, which are not likely to increase anytime soon, along with the unknowns about the future of global energy prices.
The U.S. Ten-Year Note yield (TNX) briefly dipped below 4% on the CPI news. But the rally didn’t last. And by week’s end, yields were once again moving toward the higher end of the trading range, which has been in place since October 2022.
More concerning is the lack of interest from bond traders regarding deflationary news from China a day earlier, which suggests the bond market is not a believer in the notion that inflation is slowing to the point where the Fed can stop raising rates.
In the present, you can blame their disbelief on the oil market, where volatile supply data and demand news, combined with ongoing reports that U.S. oil production is being curtailed, is moving prices higher.
Moreover, as evidenced by the action in MAXN, above, it’s becoming evident that the ongoing transfer from traditional energy to renewable energy will be more expensive than initially thought. All of which suggests that inflation is becoming stealthily embedded into the system. When you factor in the expected rise in U.S. Treasury bond issuance by the U.S. Treasury and the increasing budget deficits, the indifference from bond traders makes sense.
In other words, even though CPI may have slowed its gains for now, the bottoming of PPI may be a prelude to the near future. Thus, forward-looking bond traders may be considering future shortages of key minerals, the energy to fuel the transition to clean energy, and tight labor.
Specifically, along with poor demand for solar technology, the bond market may be quietly worried about the ongoing problems in the wind energy industry, where costs are reportedly out of control, to the tune of having climbed 20-40% since February 2022. Meanwhile, reports of major technical problems with turbines continue to plague the industry, while governments are beginning to evaluate how much more money they’re willing to put into subsidies.
NYAD Struggles, Major Indexes Extend Losses
The long-term trend for stocks remains up, but the short term is weakening further. The New York Stock Exchange Advance Decline line (NYAD), has broken below its 20-day moving average and may be headed for a test of its 50-day, and perhaps the 200-day, moving averages.
The Nasdaq 100 Index (NDX) has broken below its 50-day moving average and looks headed for a test of the 15,000 level. Accumulation/Distribution (ADI) and On Balance Volume (OBV), remain weak, as short sellers are active and sellers are overtaking buyers.
The S&P 500 (SPX) remained below 4500, and its 20-day moving average, as it approaches a test of its 50-day moving average. Both ADI and OBV are nowhere near uptrends. Support is now around the 4400 area.
VIX Struggles at 20
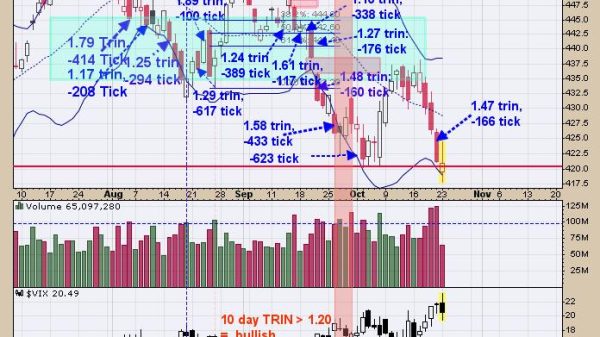
I’ve been expecting a move higher in VIX, and it seems to have arrived as the index finally moved above the key 15 resistance level. The good news is that the index has yet to break above 20. A move above 20 would be very negative, as it would signal that the big money is finally throwing in the towel on the uptrend.
When the VIX rises, stocks tend to fall, as rising put volume is a sign that market makers are selling stock index futures to hedge their put sales to the public. A fall in VIX is bullish, as it means less put option buying, and it eventually leads to call buying, which causes market makers to hedge by buying stock index futures. This raises the odds of higher stock prices.
Liquidity Remains Stable
Liquidity is stable, but may not remain so for long if the current fall in stock prices accelerates. The Secured Overnight Financing Rate (SOFR), which recently replaced the Eurodollar Index (XED), but is an approximate sign of the market’s liquidity, just broke to a new high in response to the Fed’s move. A move below 5.0 would be more bullish. A move above 5.5% would signal that monetary conditions are tightening beyond the Fed’s intentions. That would be very bearish.
To get the latest information on options trading, check out Options Trading for Dummies, now in its 4th Edition—Get Your Copy Now! Now also available in Audible audiobook format!
#1 New Release on Options Trading!
Good news! I’ve made my NYAD-Complexity – Chaos chart (featured on my YD5 videos) and a few other favorites public. You can find them here.
Joe Duarte
In The Money Options
Joe Duarte is a former money manager, an active trader, and a widely recognized independent stock market analyst since 1987. He is author of eight investment books, including the best-selling Trading Options for Dummies, rated a TOP Options Book for 2018 by Benzinga.com and now in its third edition, plus The Everything Investing in Your 20s and 30s Book and six other trading books.
The Everything Investing in Your 20s and 30s Book is available at Amazon and Barnes and Noble. It has also been recommended as a Washington Post Color of Money Book of the Month.
To receive Joe’s exclusive stock, option and ETF recommendations, in your mailbox every week visit https://joeduarteinthemoneyoptions.com/secure/order_email.asp.


